Hilbert Curve
Link to code
Link to project home
The Hilbert curve is a space filling curve derived by German mathematician David Hilbert in 1891. This curve can be drawn at different levels with increasing levels approximating the entirety of the unit square.
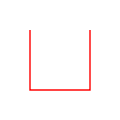
The first iteration of the Hilbert curve simple looks like a ‘U’ with rigid corners. From here on, each subsequent level can be created by drawing 4 copies of the previous levels curve in a specific orientation and then connecting those 4 curves to create one continuous line where each level tightens the spacing between the lines.
The static images seen below demonstrate this recursive technique.
 |
 |
 |
|---|---|---|
| Rigid ‘U’ shape; n = 1 | 4 smaller versions of n = 1 connected; n = 2 | 4 smaller versions of n = 2 connected; n = 3 |
(Images from the Wikipedia link below)
In my code, as opposed to performing the drawing method recursively, the implementation finds the (X, Y) coordinates of each vertex in the curve in successive order. This means the drawing technique is iterative and resembles drawing a long continuous curve as opposed to putting together disconnected pieces in each step. Much of the algorithm was traced from the ‘Iterative algorithm for drawing Hilbert curve’ which was originally written in Javascript. The piece as a whole gives great insight for deriving the algorithm from scratch by considering the curve as a maze where each n = 1 Hilbert curve is a room which has a single entrance and exit.
Following is a playback of my code running in the Processing environment:

This GIF ranges from n = 3 up to n = 9. However, the program can run down to n = 1 and is capped at n = 10 as controlled by the user. The image rending is very slow at levels higher than n = 10.
As for color, I used 1 dimensional Perlin noise that relied on the fraction of the way through the curve (e.g. 2/3 of the way through) as well as a time offset that begins at the beginning of the program. This results in both a smooth, random change in colors as the curve moves through the page, as well as a ‘forward’ movement that results in a snake like motion with the colors progressing through the body of the curve continuously over time.
Controls
↑ to zoom in
↓ to zoom out